How to Process and Generate Charts/Stats
Run this in Query Workbench, Capella Query tab, or cbq, then export as JSON.
SELECT *, meta().plan FROM system:completed_requests ORDER BY requestId LIMIT 2000;
Tip: For larger datasets, prefer targeted filters before exporting.
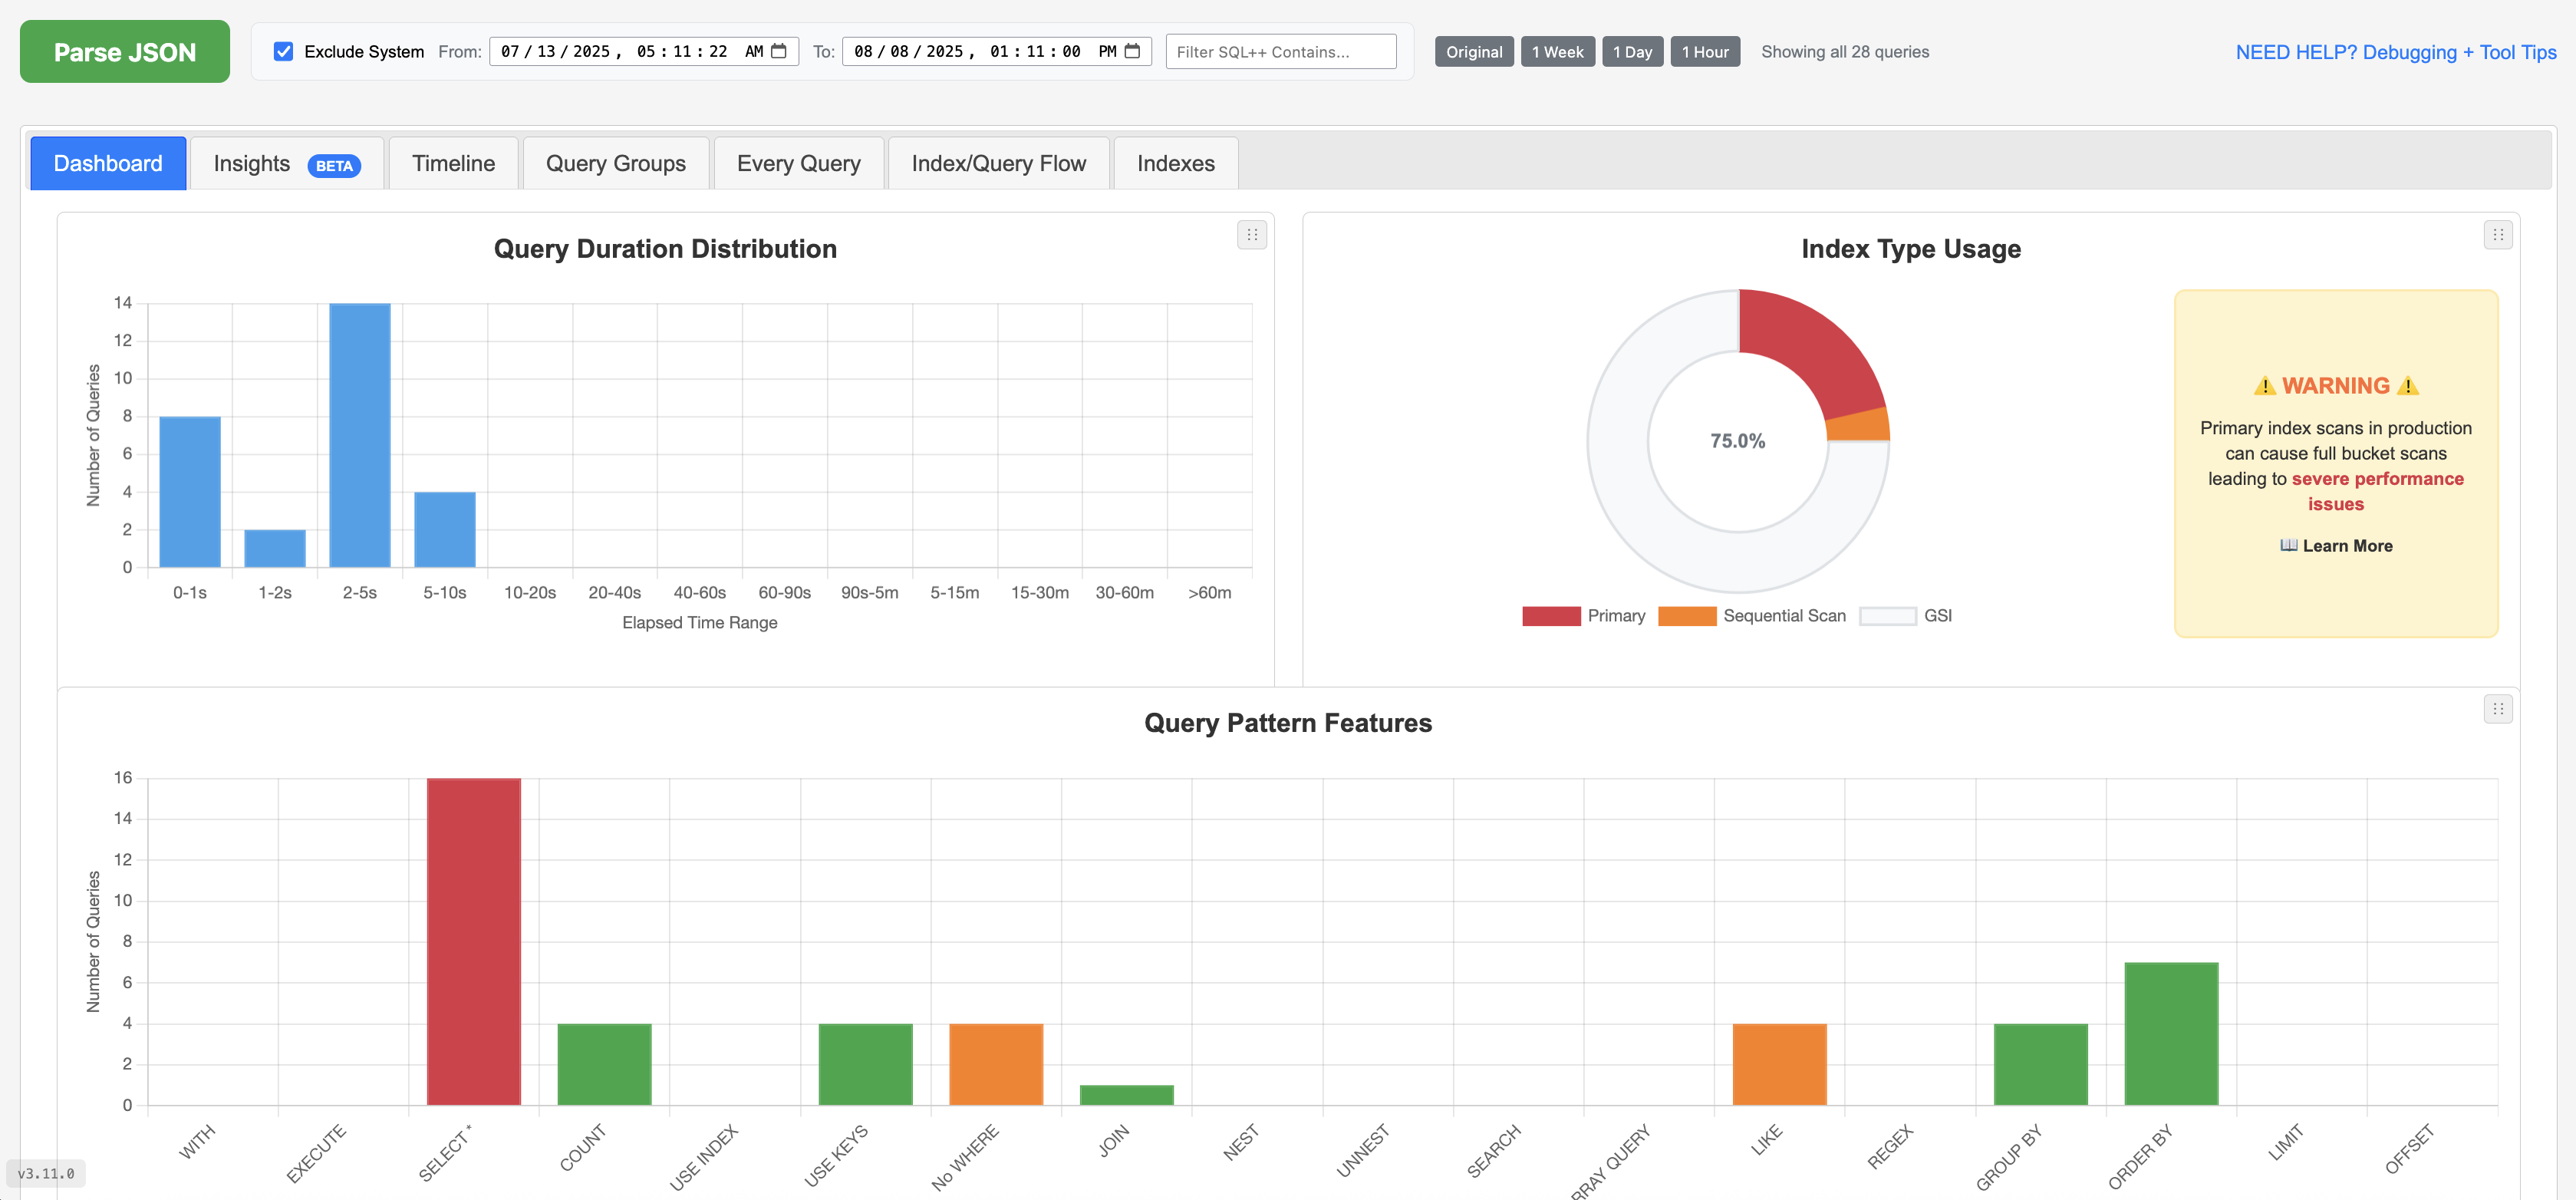
Open Analyzer — in the upper-left input, paste or upload your JSON and it will auto-parse, or click Parse JSON.
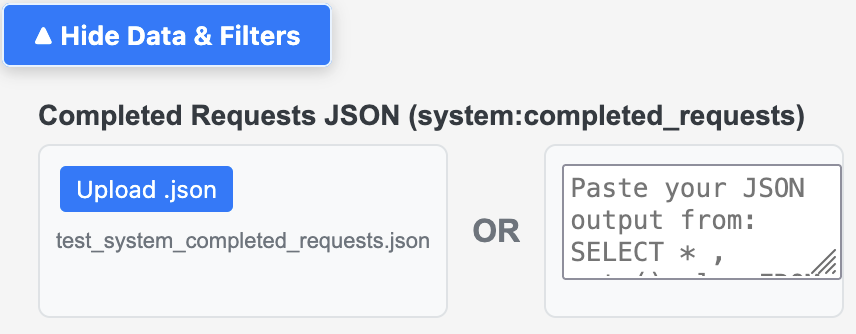
Private & secure: Runs and processes your data entirely in your browser and its memory. No server uploads.
After parsing, use filters to focus analysis:
-
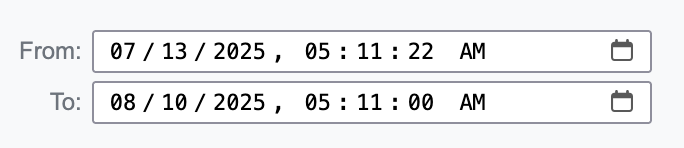
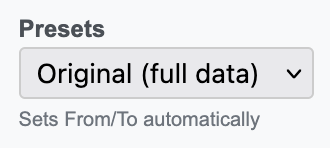
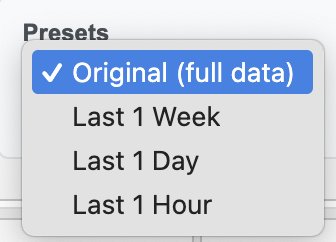
Date/Time Range — From/To with quick presets (Original | 1 Week | 1 Day | 1 Hour)
-
SQL++ Statement Contains — text filter for keywords/patterns
PRO – a great way to focus only on one query pattern and reduce the noise from other queries
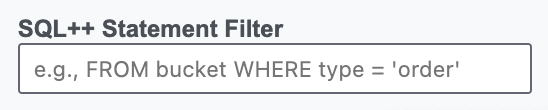
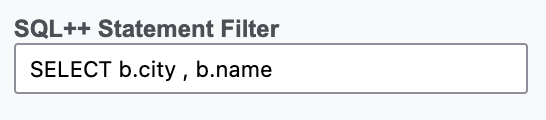
-
Elapsed Time Filter — comparisons and ranges (e.g.,
>=500ms,0.5s-2s)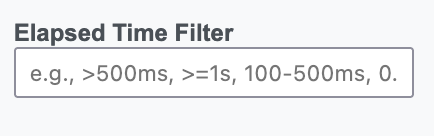
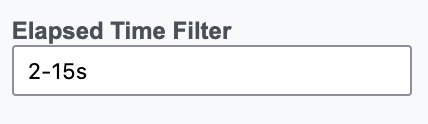 Elapsed Filter Examples
Filter by the
elapsedTimeof each query using comparisons and ranges. Supported:<,<=,=,>,>=, ranges like100-500msor0.5s-2s, unit-inferred ranges like3-15s, shorthand500ms+(means>= 500ms), and bare numbers (e.g.,150means>= 150ms).- Comparators:
>500ms,>=1s,<2s,=150ms - Ranges (inclusive):
100-500ms,0.5s-2s,3-15s(unit applied to both sides) - Shorthand:
500ms+(same as>=500ms) - Bare number:
150is interpreted as>=150ms
- Comparators:
-
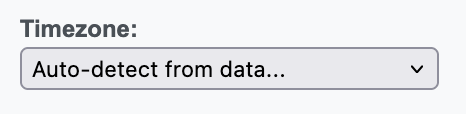
Timezone Picker — Adjust the charts/graphs x-axis time to display in your chosen timezone. Select from the dropdown to convert all timestamps accordingly.
- Exclude System Queries — hides system:*, INFER/ADVISE, CREATE/ALTER INDEX, etc.
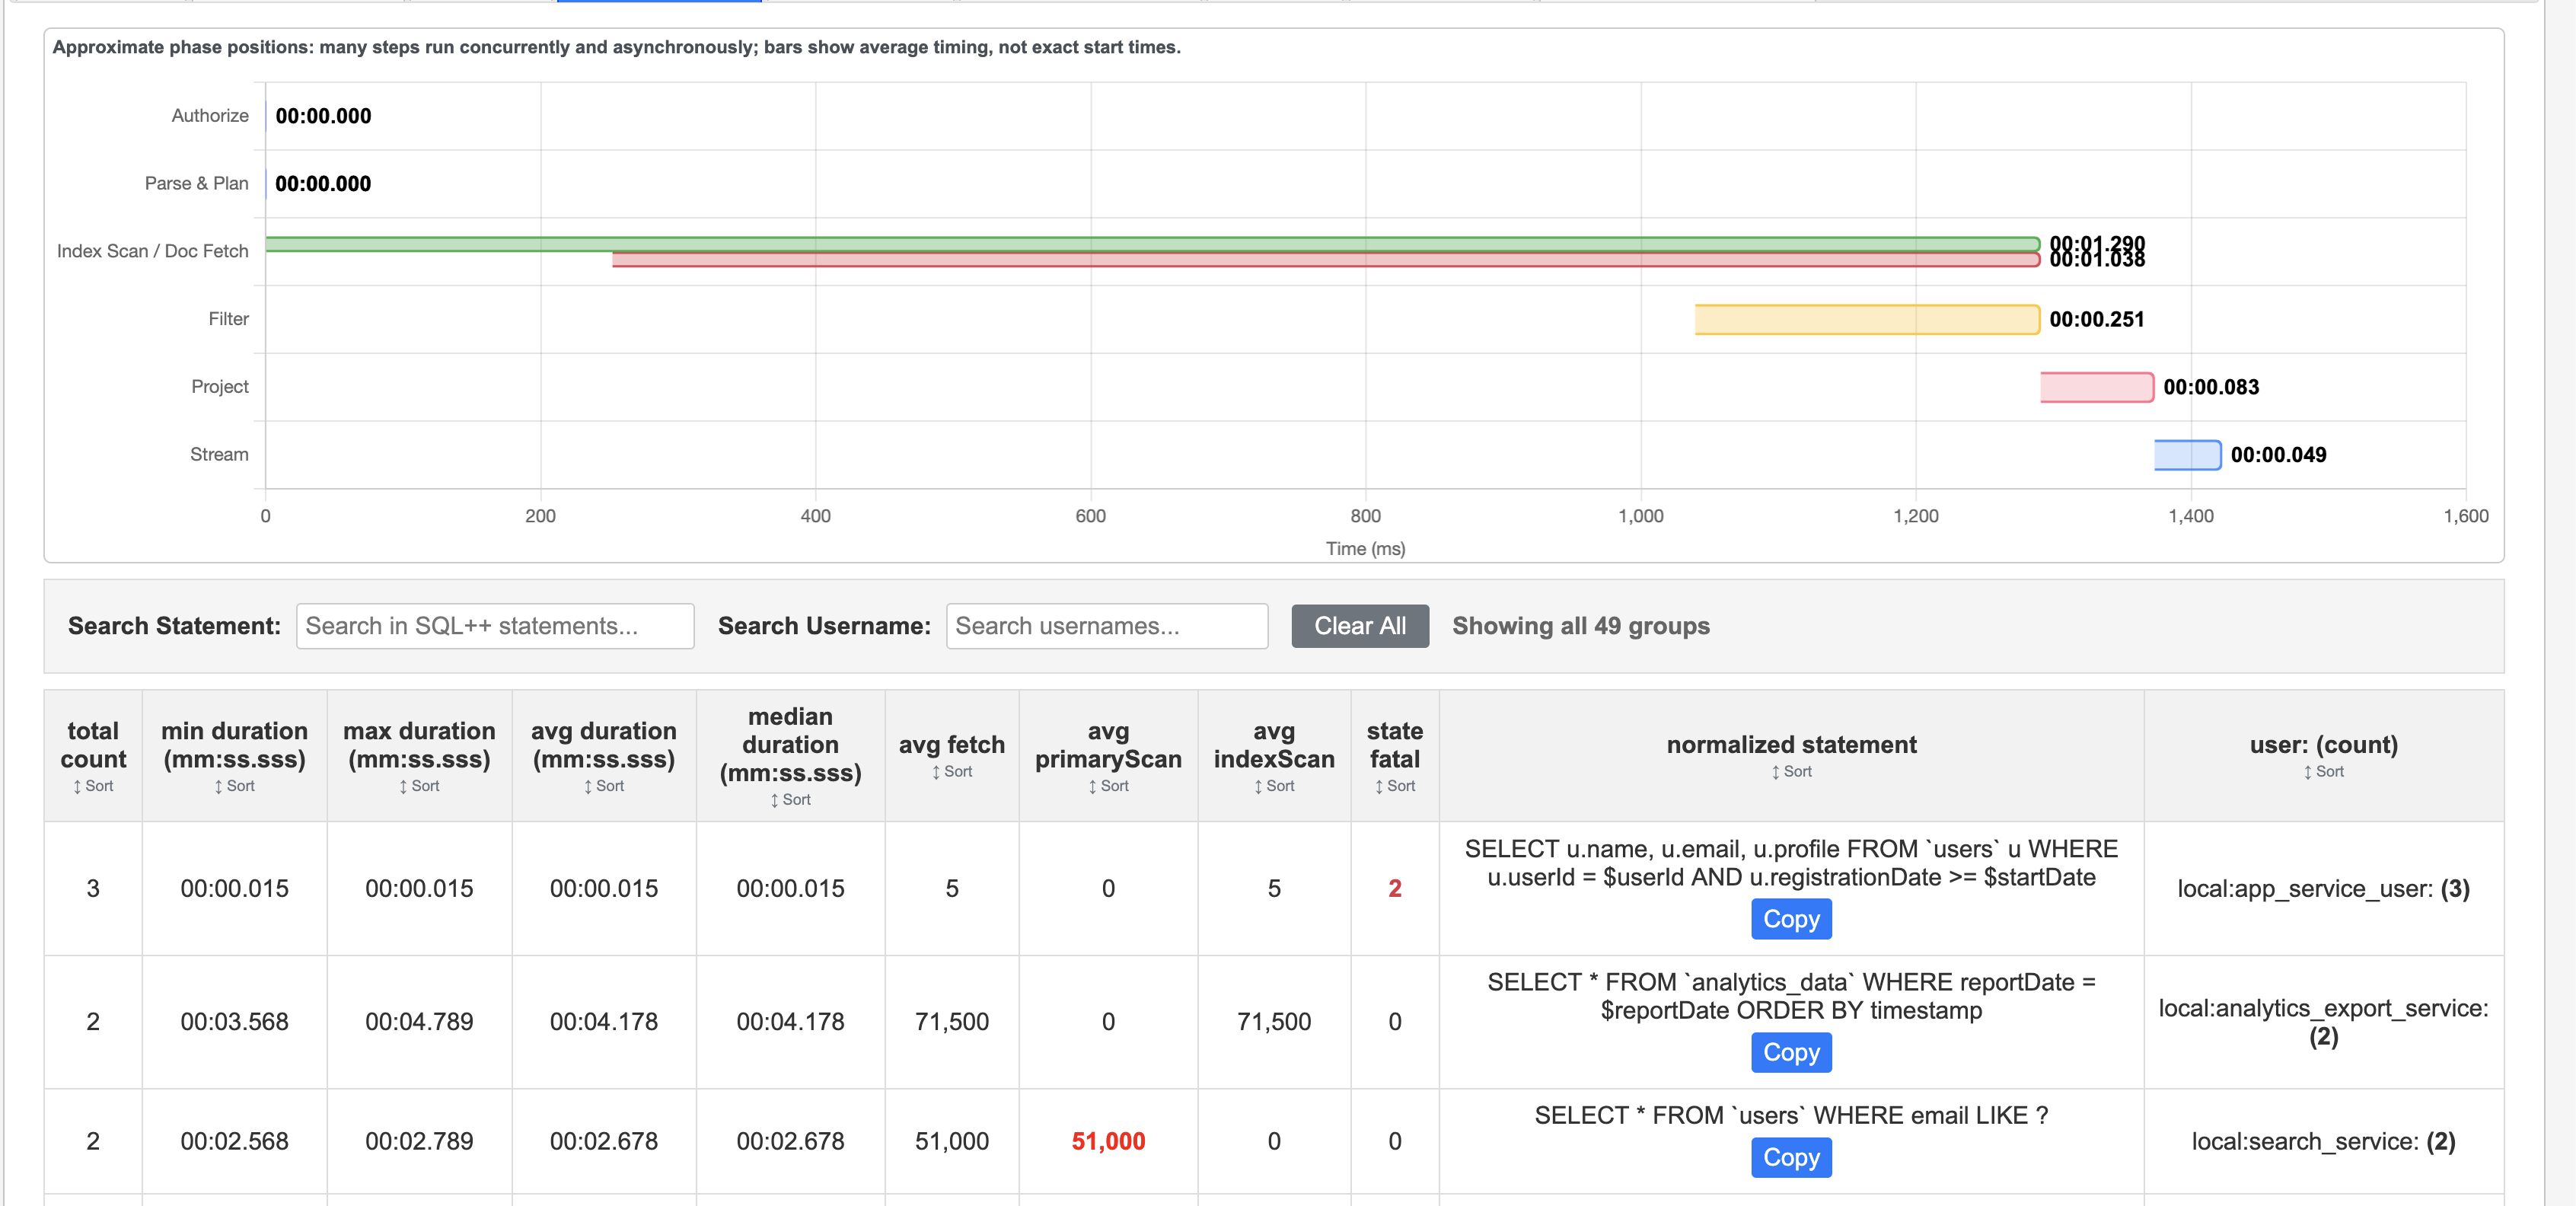
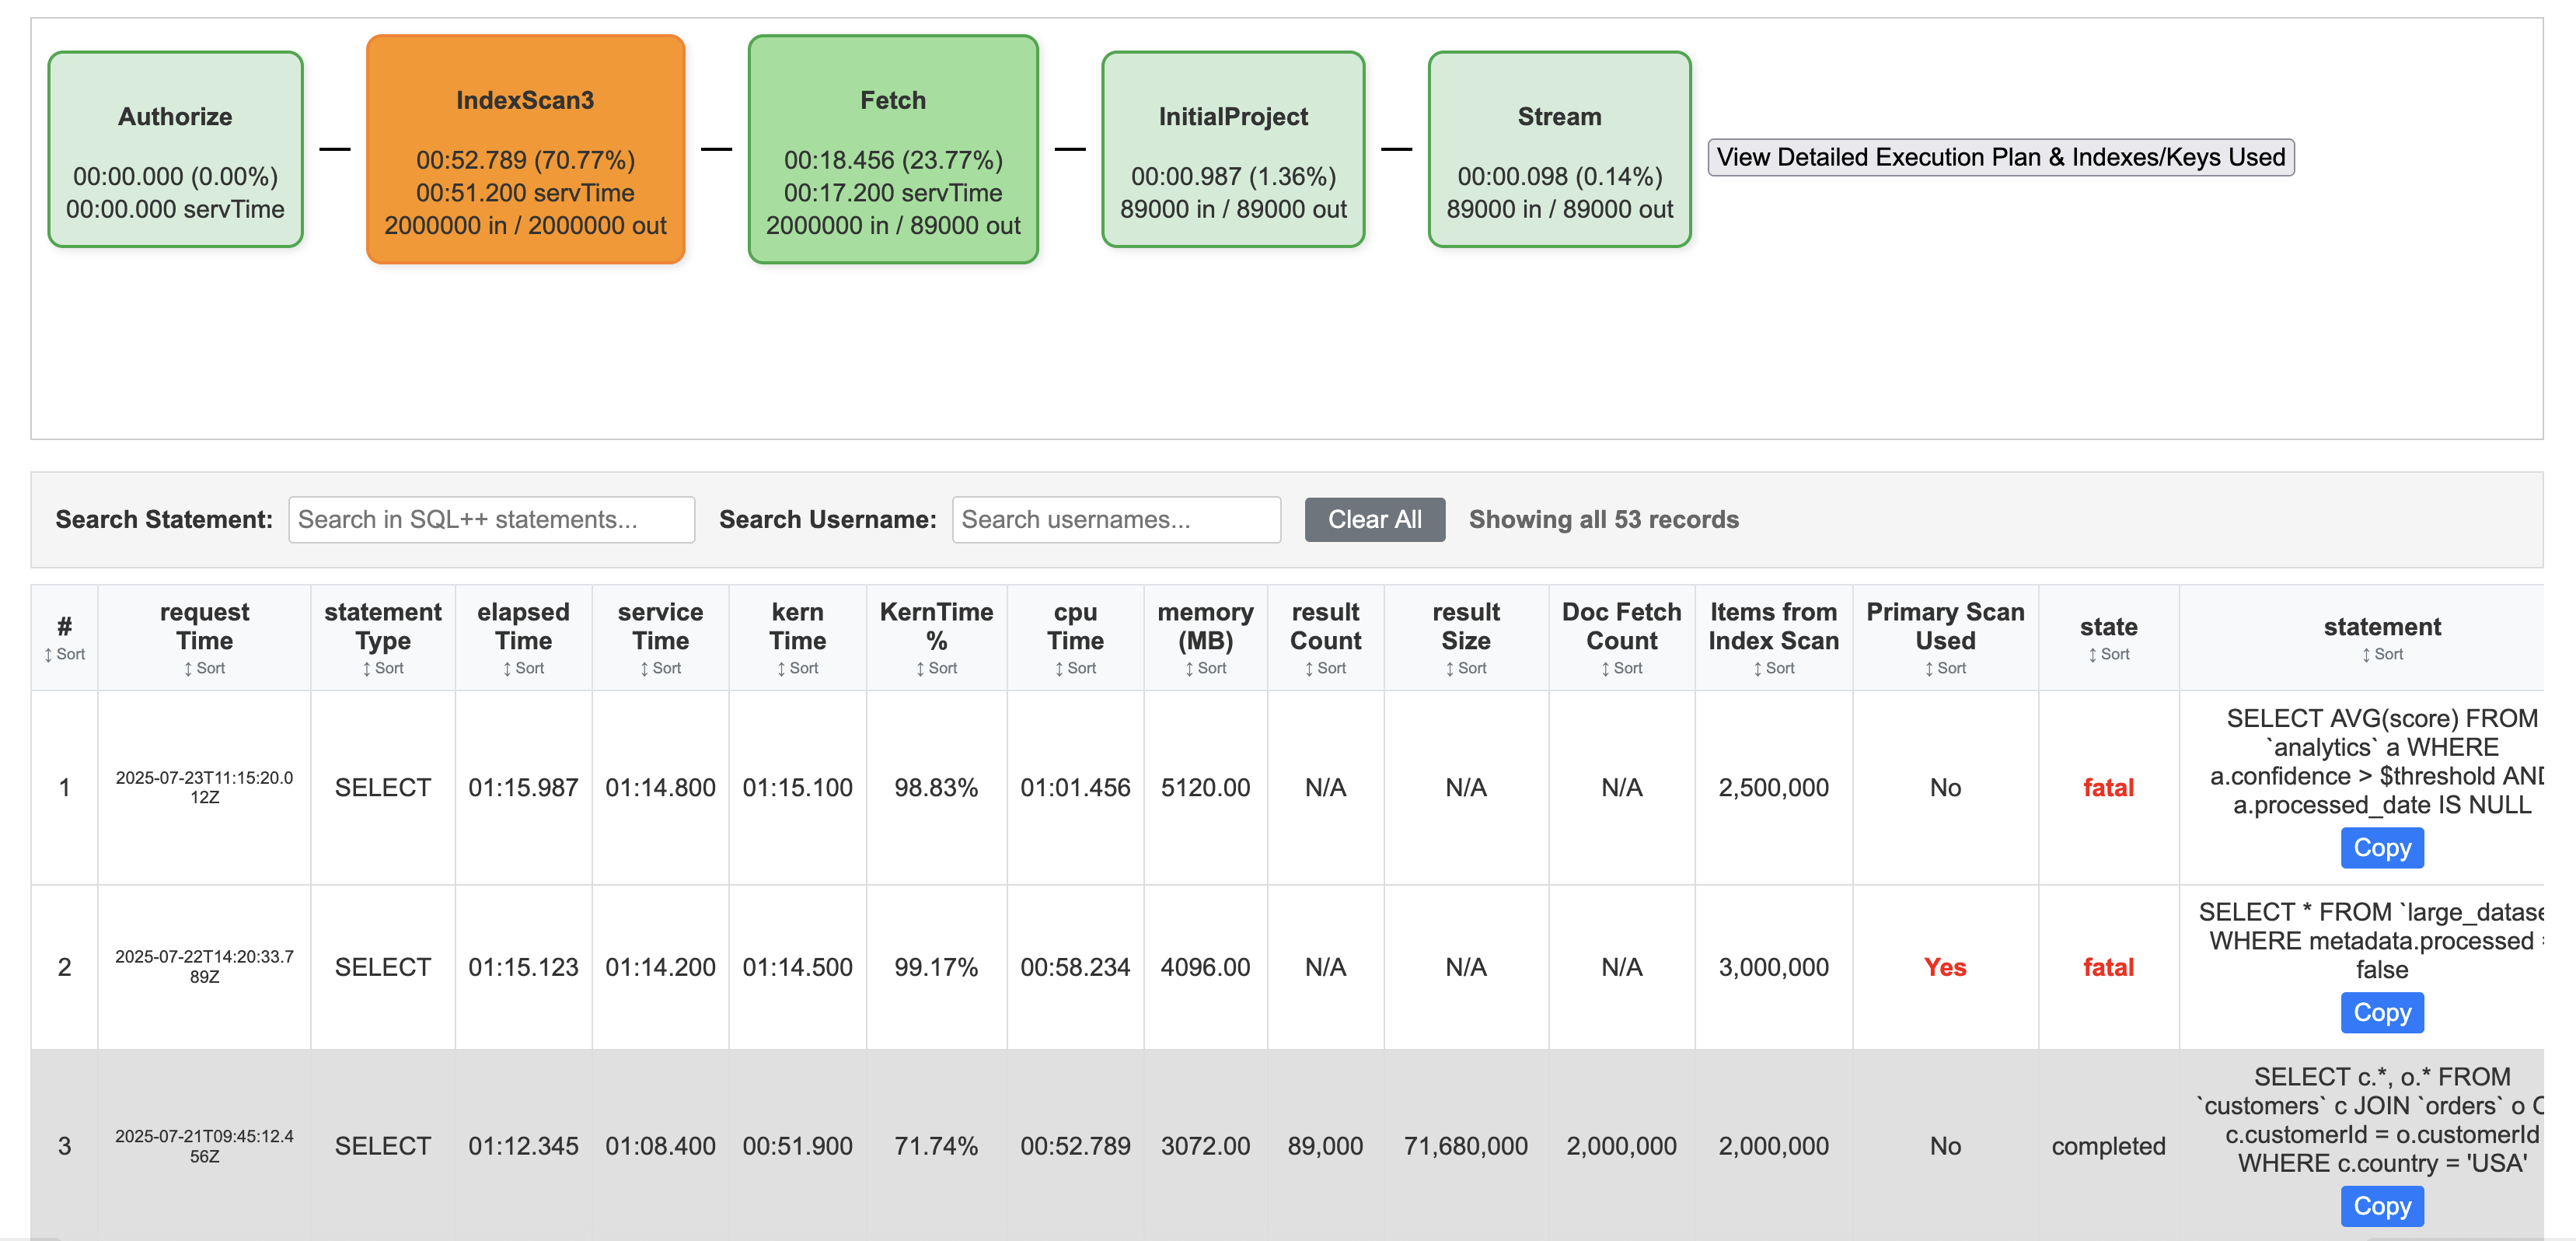
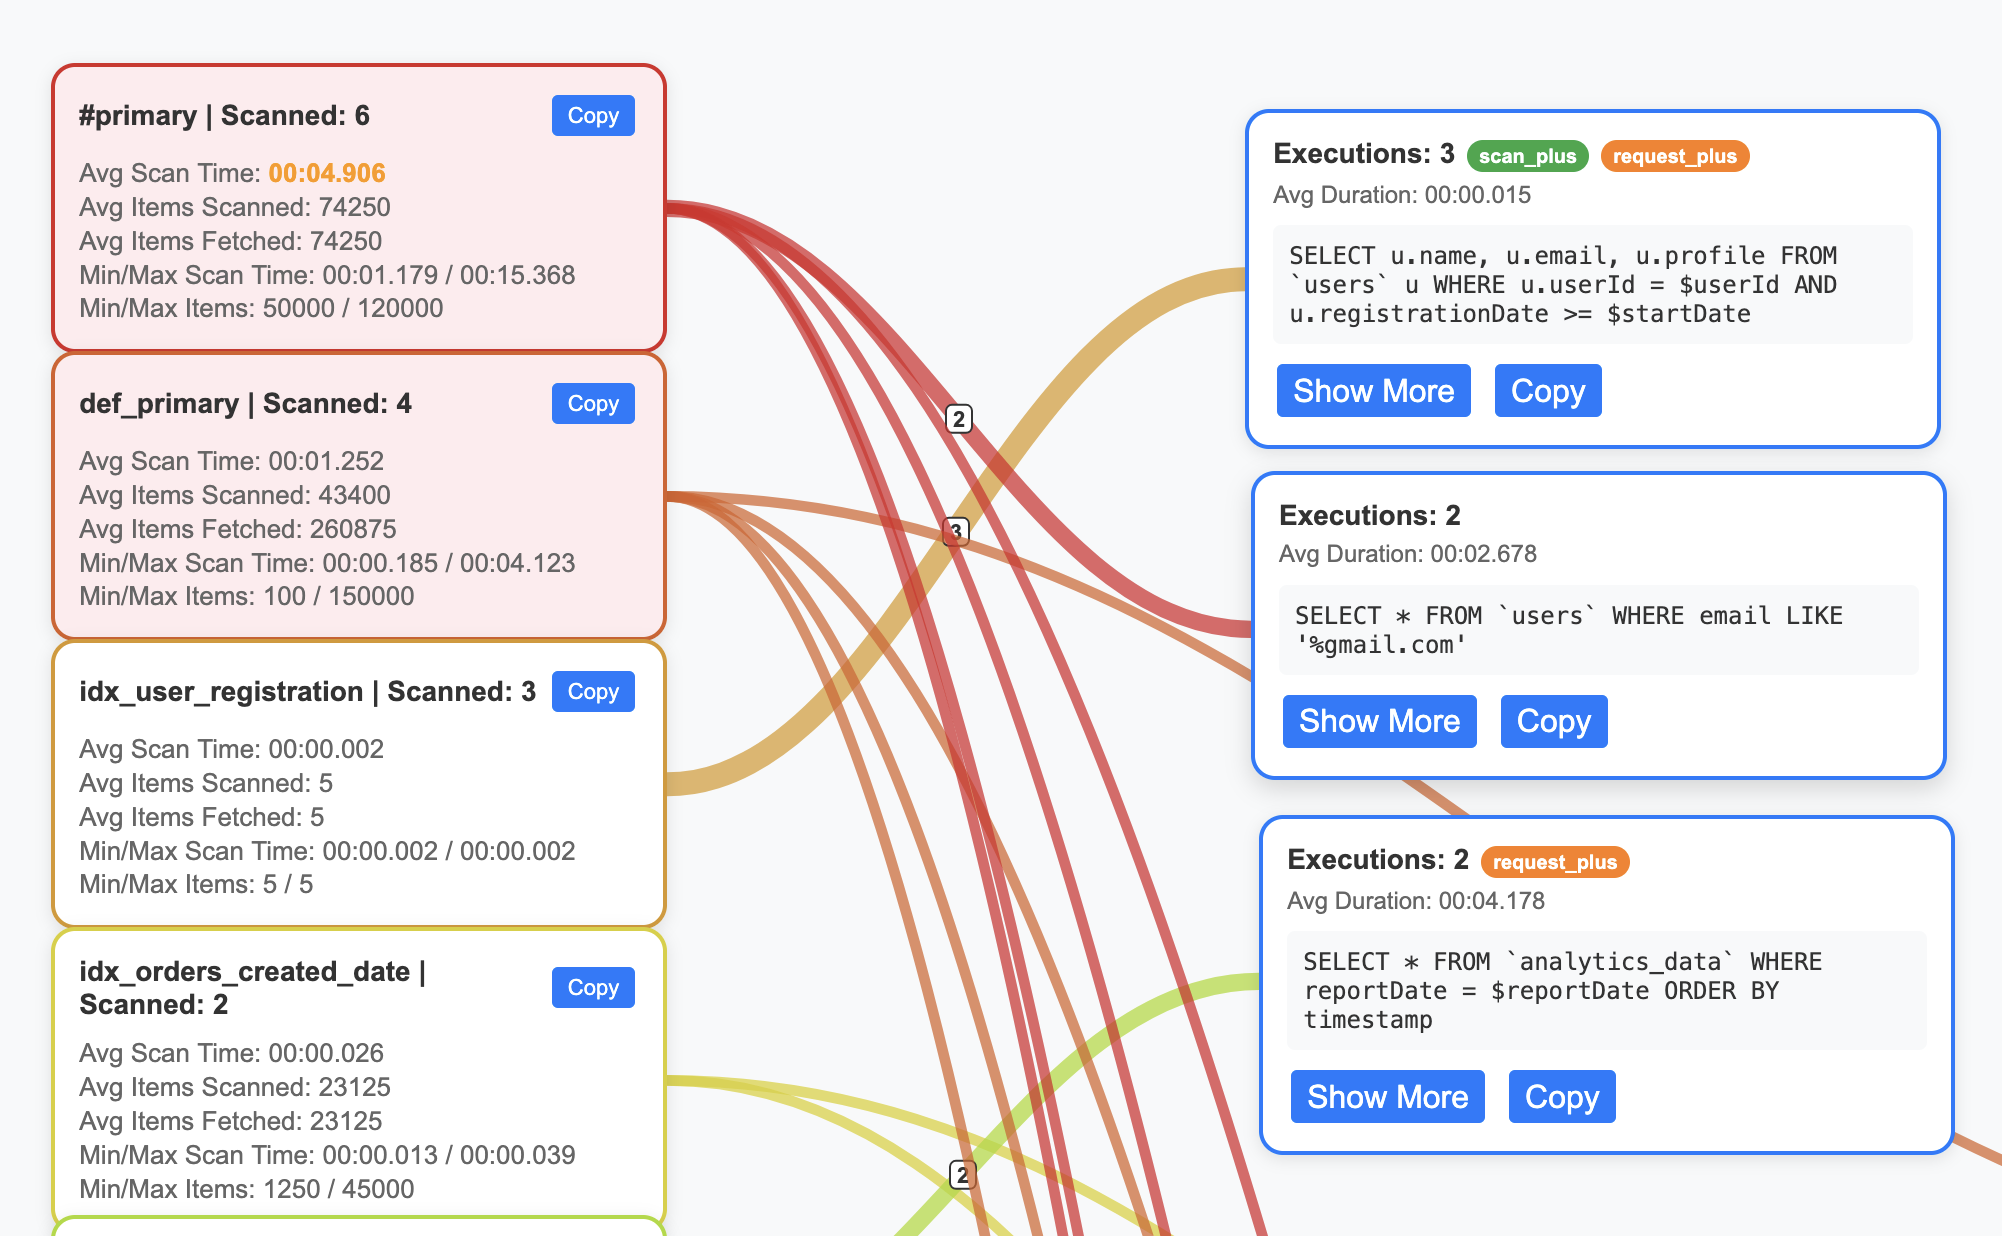
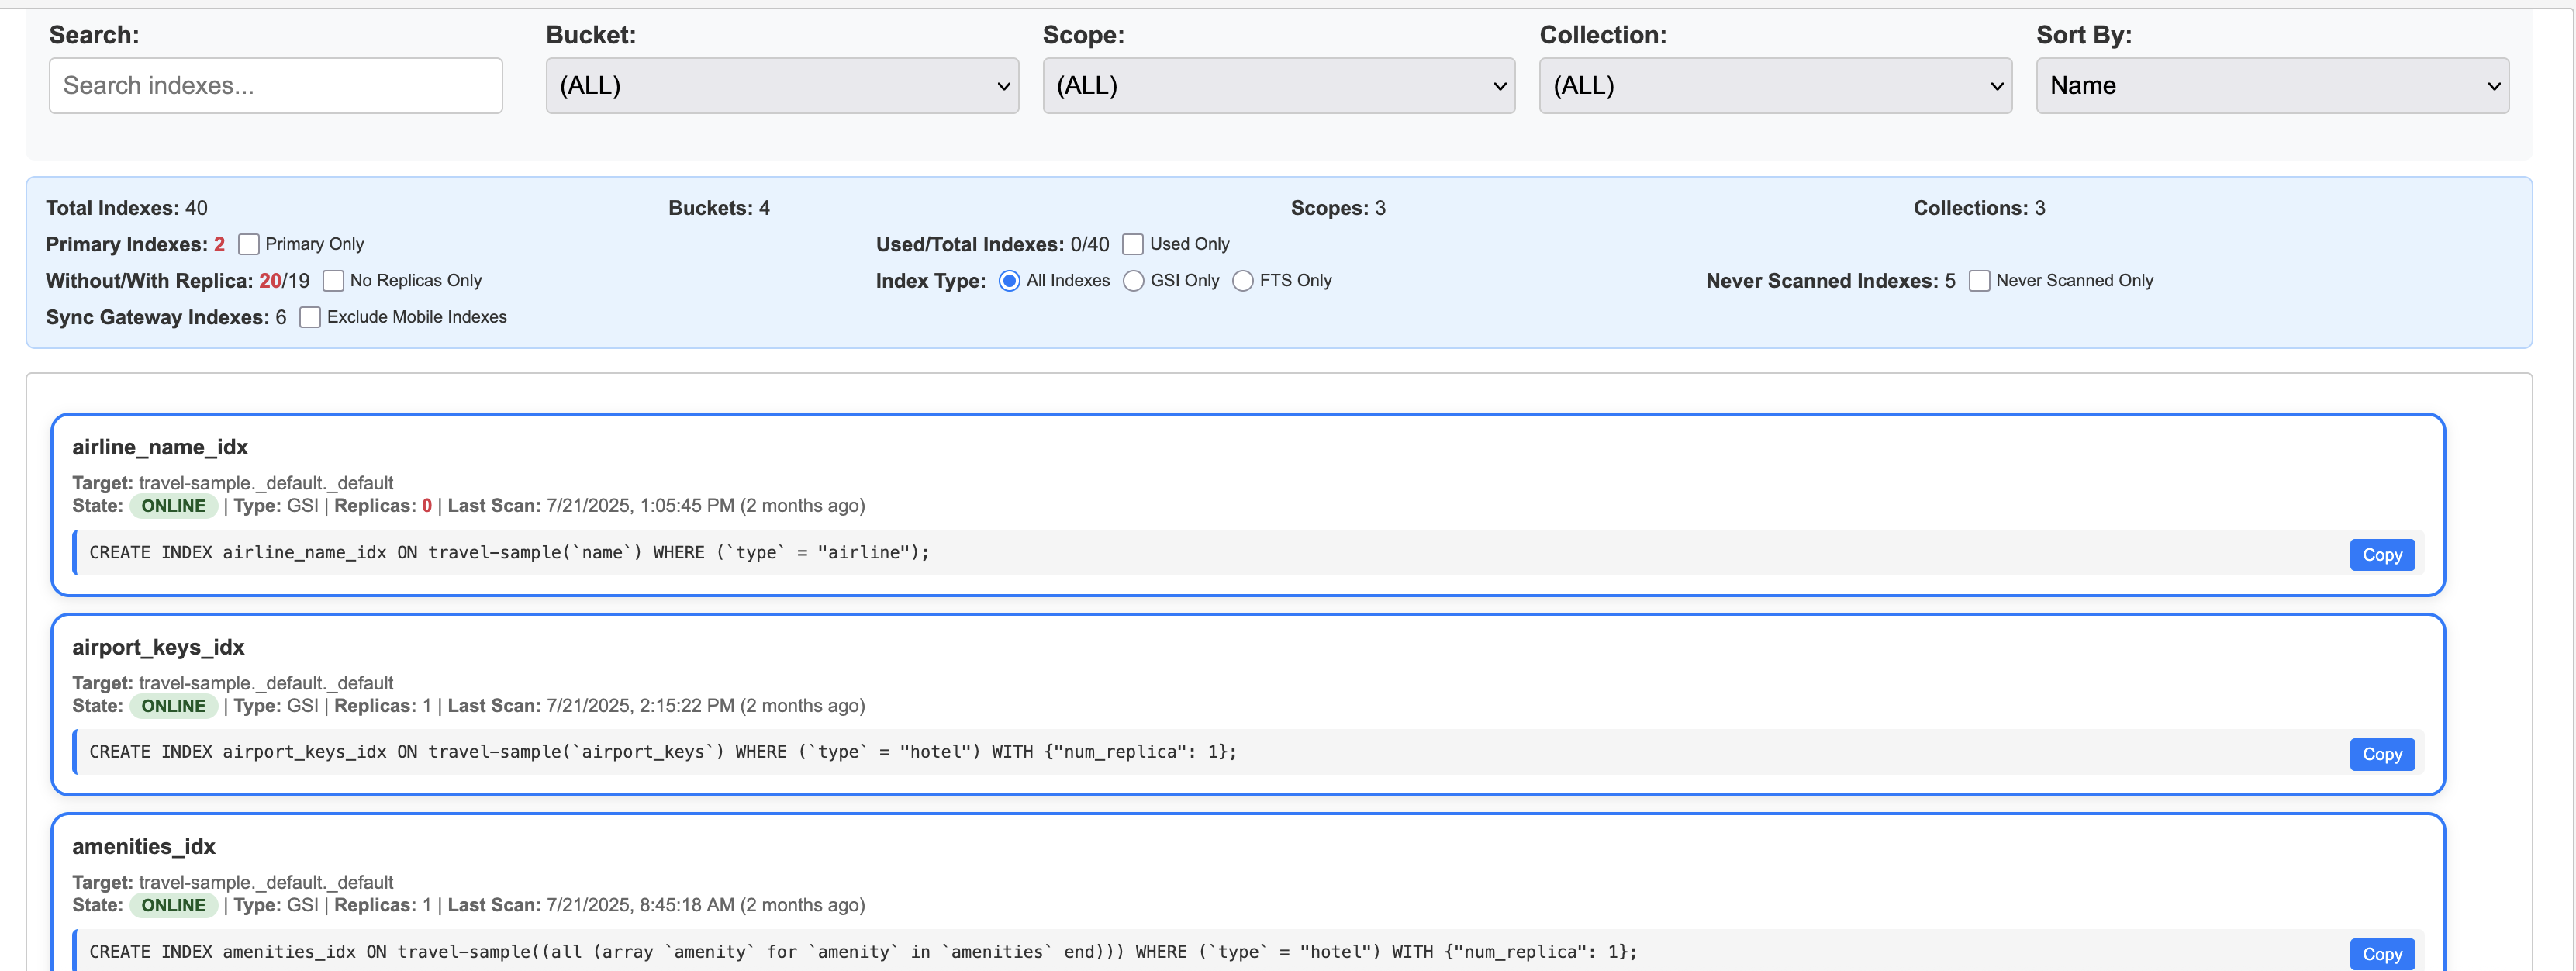
Run this separate query for system:indexes and paste/upload to the upper-right input to enrich Indexes and Flow views.
SELECT *, meta() FROM system:indexes;